Kurt Vonnegut once gave a brief, delightful lecture on the shapes of stories:
This was the primary inspiration for my latest project, which features Kurt Vonnegut’s complete works, analyzed for sentiment, and visualized as interactive word clouds. I developed it entirely in front-end JavaScript, and it’s currently hosted on GitHub pages: rossgoodwin.com/vonnegut
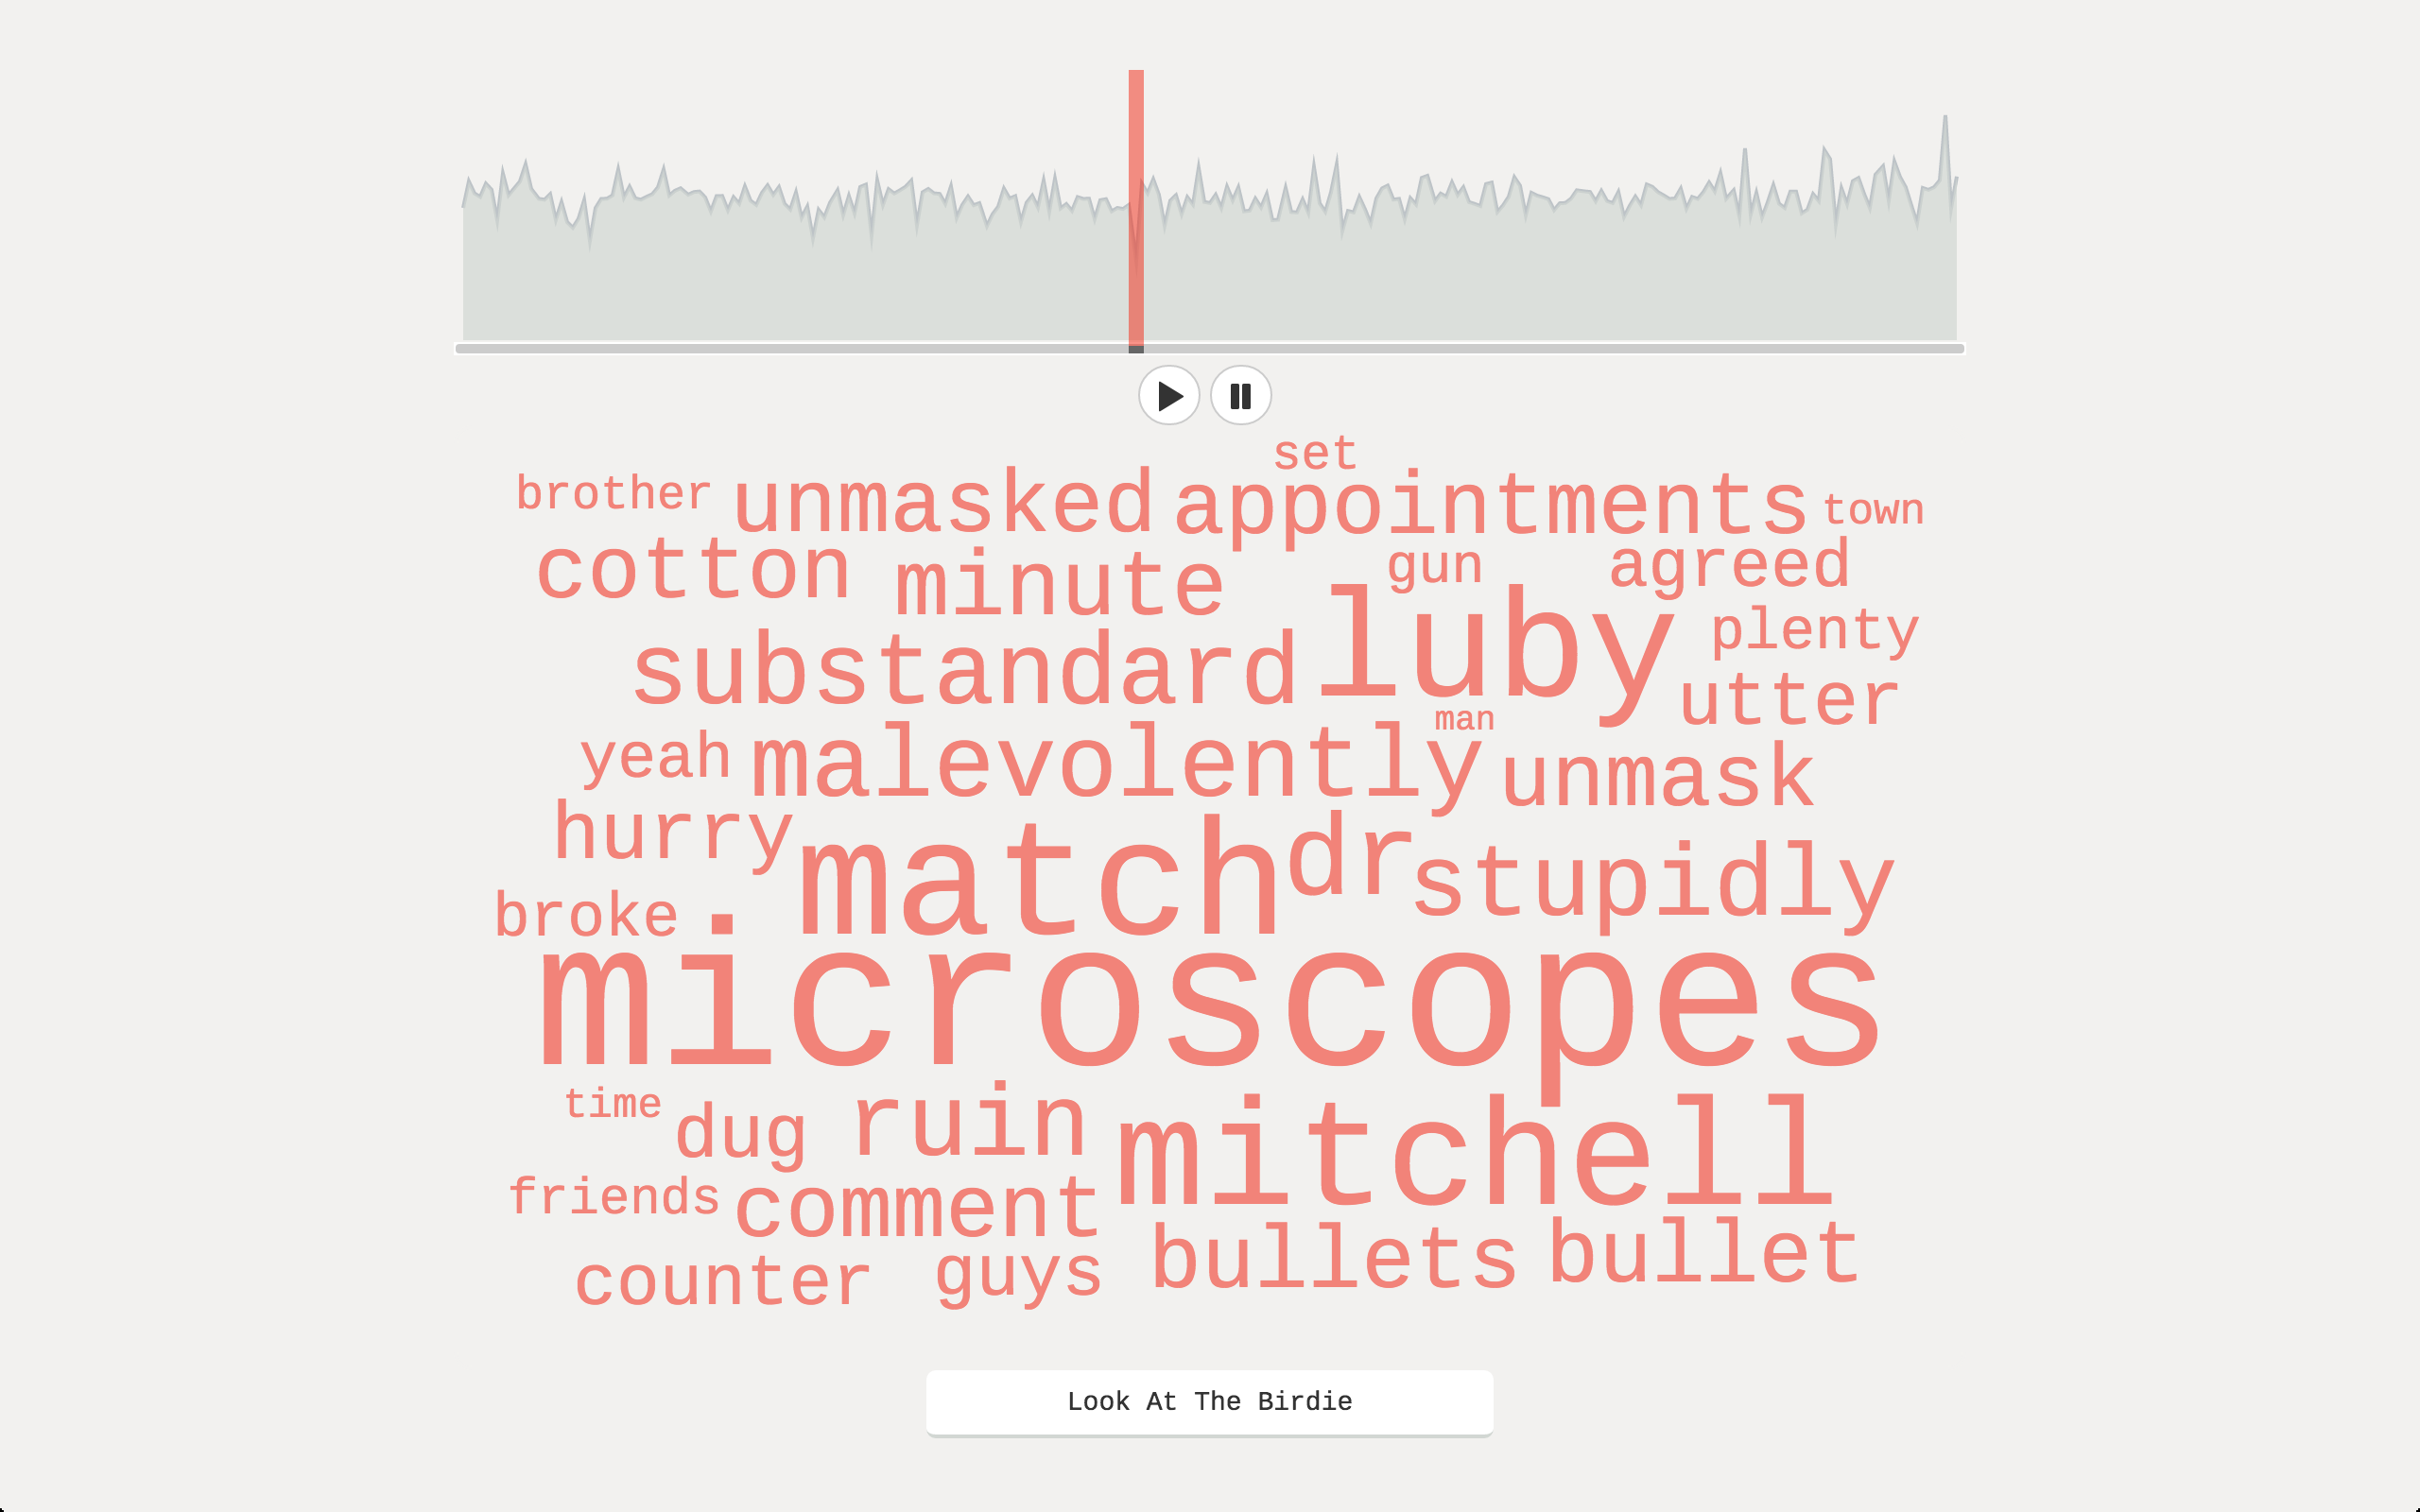
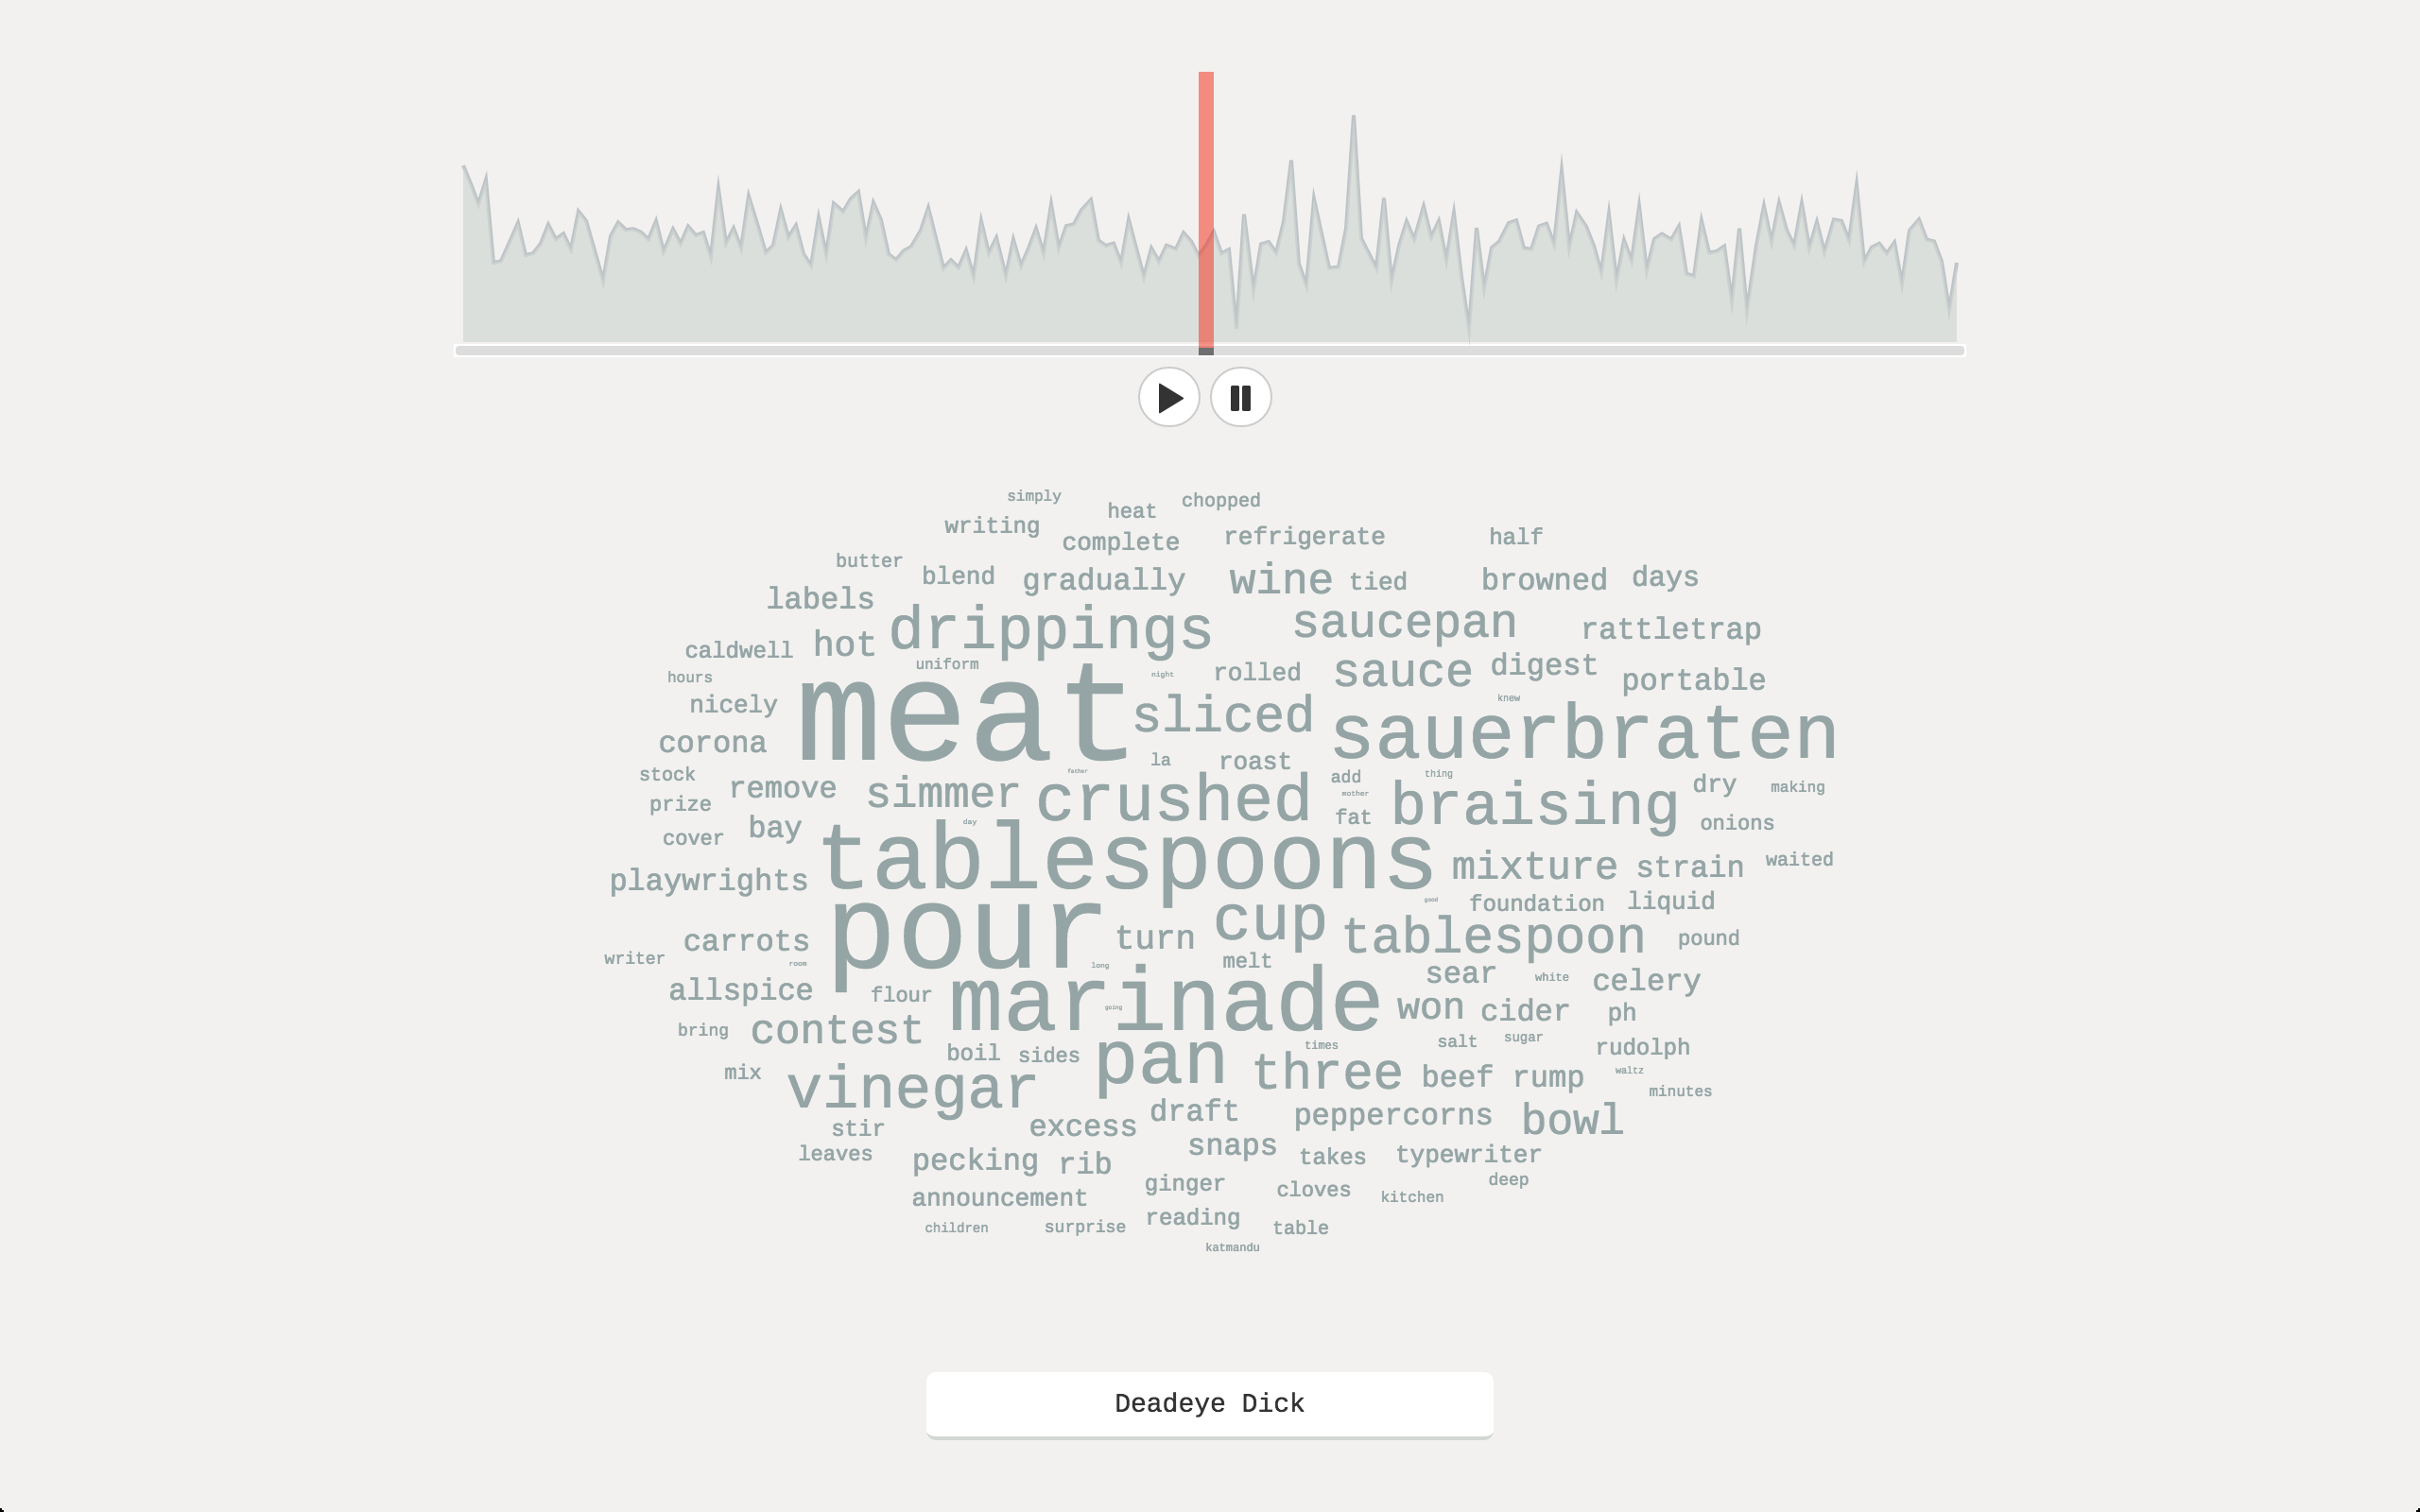
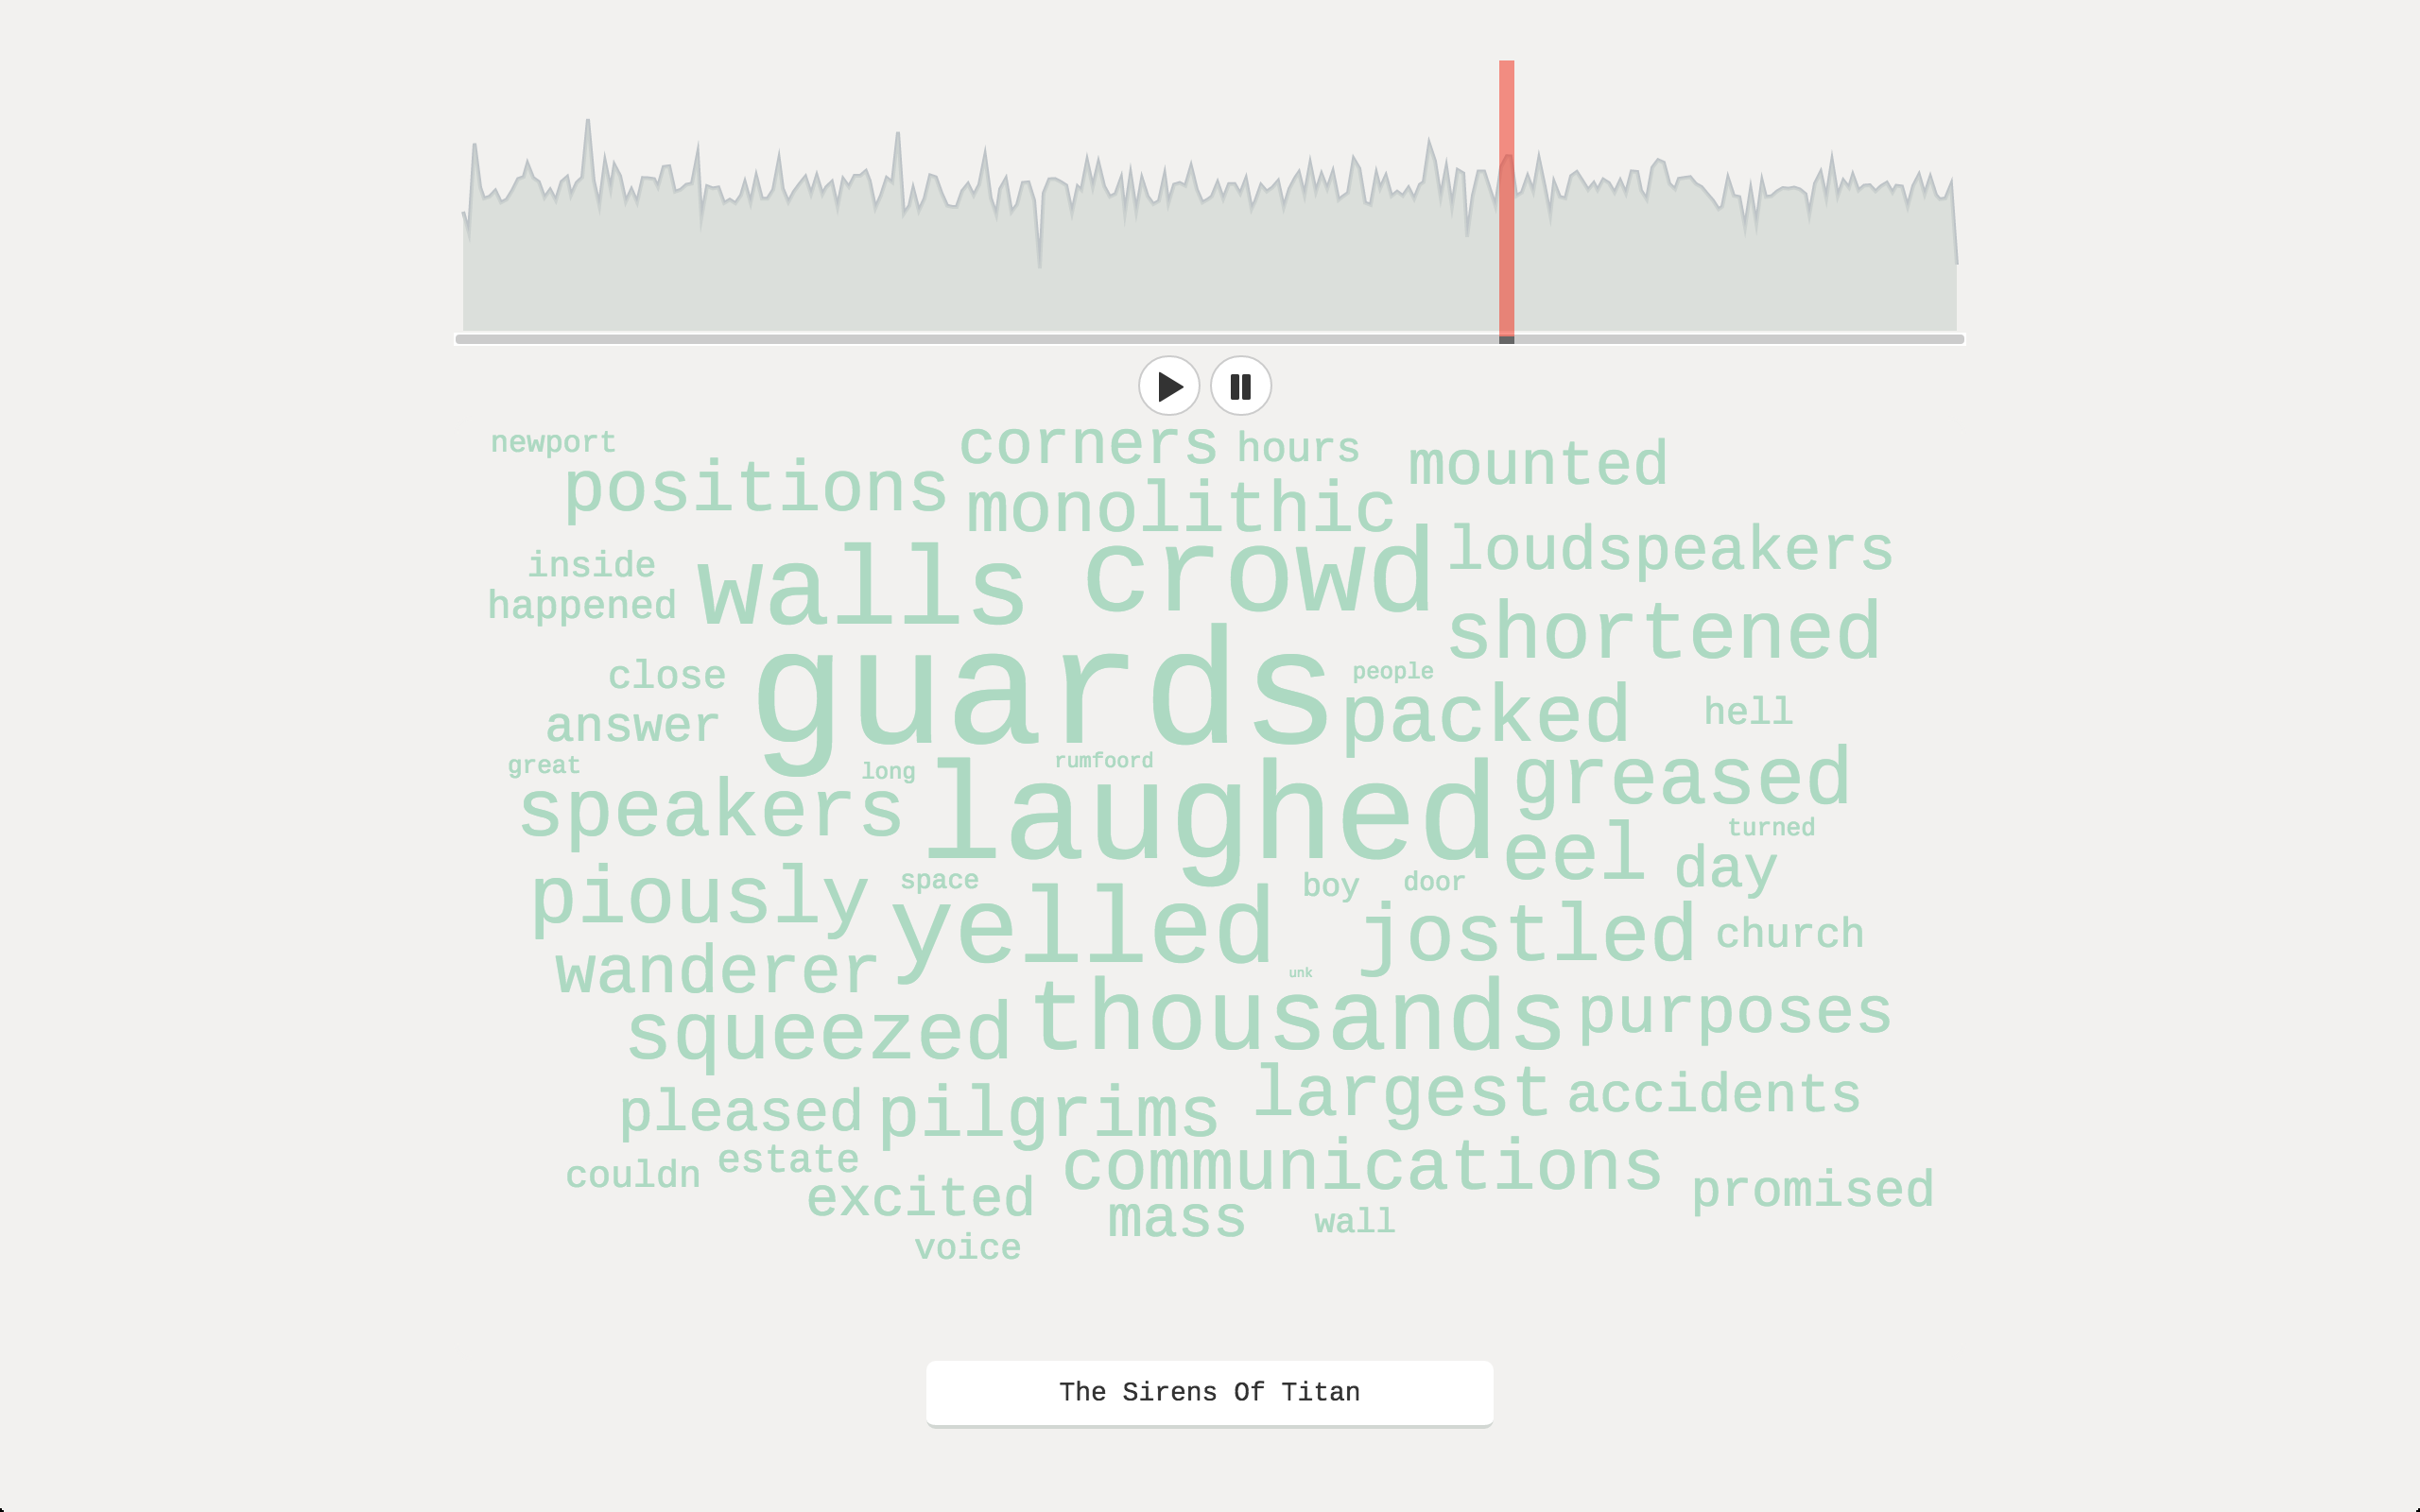
Users can scrub through the sentiment graph of each book from start to finish and see a word cloud displayed for each position on the slider. Each word cloud represents 10 paragraphs of the book. Along with the rises and dips in the graph, sentiment values are indicated by the color of the word cloud text, which ranges from dark green (highly positive) to bright red (highly negative).
Rather than simply using word count or frequency for the size of the words, I used TF-IDF scores. (Each 10 paragraph block was treated as one document, and each book was treated as an independent set of documents.) As a result, the largest words in each word cloud are those that make their respective section unique in the context of the entire book.
The first steps in creating this project were to parse Vonnegut’s books, perform TF-IDF calculations for each word and sentiment analysis for each 10-paragraph segment, then store the resulting data in a set of JSON files. Here are the iPython Notebooks where I completed these steps:
- TF-IDF Calculations
- Sentiment Analysis – Performed with the Pattern library
- Data Cleaning / Output to JSON Files – Splitting the data into over 400 JSON files was required to ensure the browser would not have to load too much information all at once.
Once I had the JSON files, I used D3 to create the word clouds and Chart.js to create the line graphs. The sliders are HTML range inputs, modified with custom CSS. I wanted to create the appearance of long, semi-transparent planchettes sliding over the graphs. Getting the sliders to line up with the graphs precisely was particularly challenging, as was providing the option to click on the graphs in any location and automatically move the sliders to that location.
Here is my JavaScript code, in its current state:
|
1 2 3 4 5 6 7 8 9 10 11 12 13 14 15 16 17 18 19 20 21 22 23 24 25 26 27 28 29 30 31 32 33 34 35 36 37 38 39 40 41 42 43 44 45 46 47 48 49 50 51 52 53 54 55 56 57 58 59 60 61 62 63 64 65 66 67 68 69 70 71 72 73 74 75 76 77 78 79 80 81 82 83 84 85 86 87 88 89 90 91 92 93 94 95 96 97 98 99 100 101 102 103 104 105 106 107 108 109 110 111 112 113 114 115 116 117 118 119 120 121 122 123 124 125 126 127 128 129 130 131 132 133 134 135 136 137 138 139 140 141 142 143 144 145 146 147 148 149 150 151 152 153 154 155 156 157 158 159 160 161 162 163 164 165 166 167 168 169 170 171 172 173 174 175 176 177 178 179 180 181 182 183 184 185 186 187 188 189 190 191 192 193 194 195 196 197 198 199 200 201 202 203 204 205 206 207 208 209 210 211 212 213 214 215 |
(function() { Number.prototype.map = function (in_min, in_max, out_min, out_max) { return (this - in_min) * (out_max - out_min) / (in_max - in_min) + out_min; } function titleCase(str) { return str.replace(/\w\S*/g, function(txt){return txt.charAt(0).toUpperCase() + txt.substr(1).toLowerCase();}); } // Charts.js global config Chart.defaults.global.animation = false; Chart.defaults.global.tooltipEvents = []; Chart.defaults.global.scaleFontFamily = "'Cousine', monospace"; Chart.defaults.global.showScale = false; // var spectrum = ['#F22613', '#E74C3C', '#D35400', '#F2784B', '#95A5A6', '#68C3A3', '#4DAF7C', '#3FC380', '#2ECC71']; var spectrum = ["#f22613", "#f25749", "#f28379", "#f2b0aa", "#95a5a6", "#add9c2", "#74b391", "#45996c", "#1e824c"]; $("#key-block").append( '<div id=\"key-text-box\"><p class=\"text-center lead small\" style=\"margin-left: 7px;\"><<< negative | positive >>></p></div>' ); spectrum.map(function(hex){ $("#key-block").append( '<div class=\"key-color\" style=\"background-color:'+hex+';\"></div>' ); }); function updateCloud(bookslug, section) { $.getJSON("data/vonnegut-"+section+".json", function(data){ // var factor = Math.pow(data[bookslug]['tfidf'].length, 2); var layout = d3.layout.cloud() .size([800, 500]) .words(data[bookslug]['tfidf'].map(function(d) { return {text: d[0], size: d[1] * 500}; })) .padding(3) .rotate(function() { return 0; }) // return ~~(Math.random() * 2) * 90 .font("Cousine") .fontSize(function(d) { return d.size; }) .on("end", draw); layout.start(); function draw(words) { var overallContainer = d3.select("#"+bookslug); overallContainer.select("svg").remove(); overallContainer.select("a").remove(); var svgContainer = overallContainer.append("svg") .attr("width", layout.size()[0]) .attr("height", layout.size()[1]) .attr("class", "svg-cont"); var wordCloud = svgContainer.append("g") .attr("transform", "translate(" + layout.size()[0] / 2 + "," + layout.size()[1] / 2 + ")") .selectAll("text") .data(words) .enter().append("text") .transition().duration(500) .style("font-size", function(d) { return d.size + "px"; }) .style("font-family", "Cousine") .style("fill", function(d, i) { var sentiment = data[bookslug]['sentiment']; var ix = Math.floor(((sentiment + 1)/2)*spectrum.length); return spectrum[ix]; }) .attr("text-anchor", "middle") .attr("transform", function(d) { return "translate(" + [d.x, d.y] + ")rotate(" + d.rotate + ")"; }) .text(function(d) { return d.text; }); var title = titleCase(data[bookslug]['title']); var labelText = overallContainer .append("a") .attr("href", "http://www.amazon.com/exec/obidos/external-search/?field-keywords=%s"+title+"&mode=blended") .attr("class", "twitter-link") .attr("target", "_blank") .text(title); overallContainer.transition() .style("opacity", 1.0) .delay(1000) .duration(3000); } }); } $.getJSON("data/sentiment.json", function(sent){ $.getJSON("data/vonnegut-0.json", function(data){ $("#loadinggif").fadeOut("slow"); Object.keys(data).sort().map(function(slug){ $("#vis").append( '<div id=\"'+slug+'\" class=\"col-md-12 transparent text-center\"></div>' ); $("#"+slug).append( '<canvas class="chart-canvas" id=\"'+slug+'-chart\" width=\"800\" height=\"150\"></canvas>' ); var ctx = document.getElementById(slug+"-chart").getContext("2d"); var xLabels = []; for (var i=0;i<data[slug]['length'];i++) { xLabels.push(''); } var chartData = { labels: xLabels, datasets: [ { label: titleCase(data[slug]['title']), fillColor: "rgba(210, 215, 211, 0.7)", strokeColor: "rgba(189, 195, 199, 1)", pointColor: "rgba(210, 215, 211, 1)", pointStrokeColor: "#fff", pointHighlightFill: "#fff", pointHighlightStroke: "rgba(220,220,220,1)", data: sent[slug] } ] }; var chartOptions = { pointDot : false, pointHitDetectionRadius : 5, scaleShowVerticalLines: false, bezierCurve: false }; var myNewChart = new Chart(ctx).Line(chartData, chartOptions); var stepCount = data[slug]['length'] - 1; $("#"+slug).append( '<div class=\"scrubber\"><input id=\"'+slug+'-scrub\" type=\"range\" min=\"0\" max=\"'+stepCount+'\" value=\"0\" step=\"1\"></div>' ); $("#"+slug+"-chart").on("click", function(evt){ var activePoints = myNewChart.getPointsAtEvent(evt); var xPos = activePoints[Math.floor(activePoints.length/2)].x; var ix = Math.floor(xPos.map(0, 800, 0, data[slug]['length'])); console.log(xPos); console.log(ix); $('#'+slug+'-scrub').val(ix); updateCloud(slug, ix); }); // Play Button $('#'+slug).append( '<button type=\"button\" id=\"'+slug+'-btn\" class=\"btn btn-default btn-xs play-btn\" aria-label=\"Play\"><span class=\"glyphicon glyphicon-play\" aria-hidden=\"true\"></span></button>' ); $('#'+slug).append( '<button type=\"button\" id=\"'+slug+'-btn-pause\" class=\"btn btn-default btn-xs play-btn\" aria-label=\"Pause\"><span class=\"glyphicon glyphicon-pause\" aria-hidden=\"true\"></span></button>' ); // Load First Clouds updateCloud(slug, 0); var play; $('#'+slug+'-btn').click(function(){ console.log('clicked ' + slug); autoAdvance(); play = setInterval(function(){ autoAdvance(); }, 5000); function autoAdvance(){ var scrubVal = $('#'+slug+'-scrub').val(); console.log(data[slug]['length']); if (scrubVal >= data[slug]['length']-1) { console.log("EOR"); clearInterval(play); } console.log(scrubVal); var newVal = parseInt(scrubVal, 10) + 1; $('#'+slug+'-scrub').val(newVal); updateCloud(slug, newVal); } }); $('#'+slug+'-btn-pause').click(function(){ clearInterval(play); }); $("#"+slug+"-scrub").on("input", function(){ var sectNo = $(this).val(); console.log(sectNo); updateCloud(slug, sectNo); }); }); }); }); })(); |
The rest of my front-end code can be found on GitHub.